Performance Statistics explained – how to understand and use our stats
The Autochartist Performance Statistics Tool is a powerful resource that provides factual information on the success rate of Autochartist forecasts over the last 12 months. It helps traders make more informed trading decisions based on historical success rates and pattern outcomes.
Performance statistics is a valuable addition to the Autochartist Technical Analysis tools as it provides statistical data on the accuracy and actionability of trade setups presented. Traders can glean insights that can assist them in building their trading strategy.
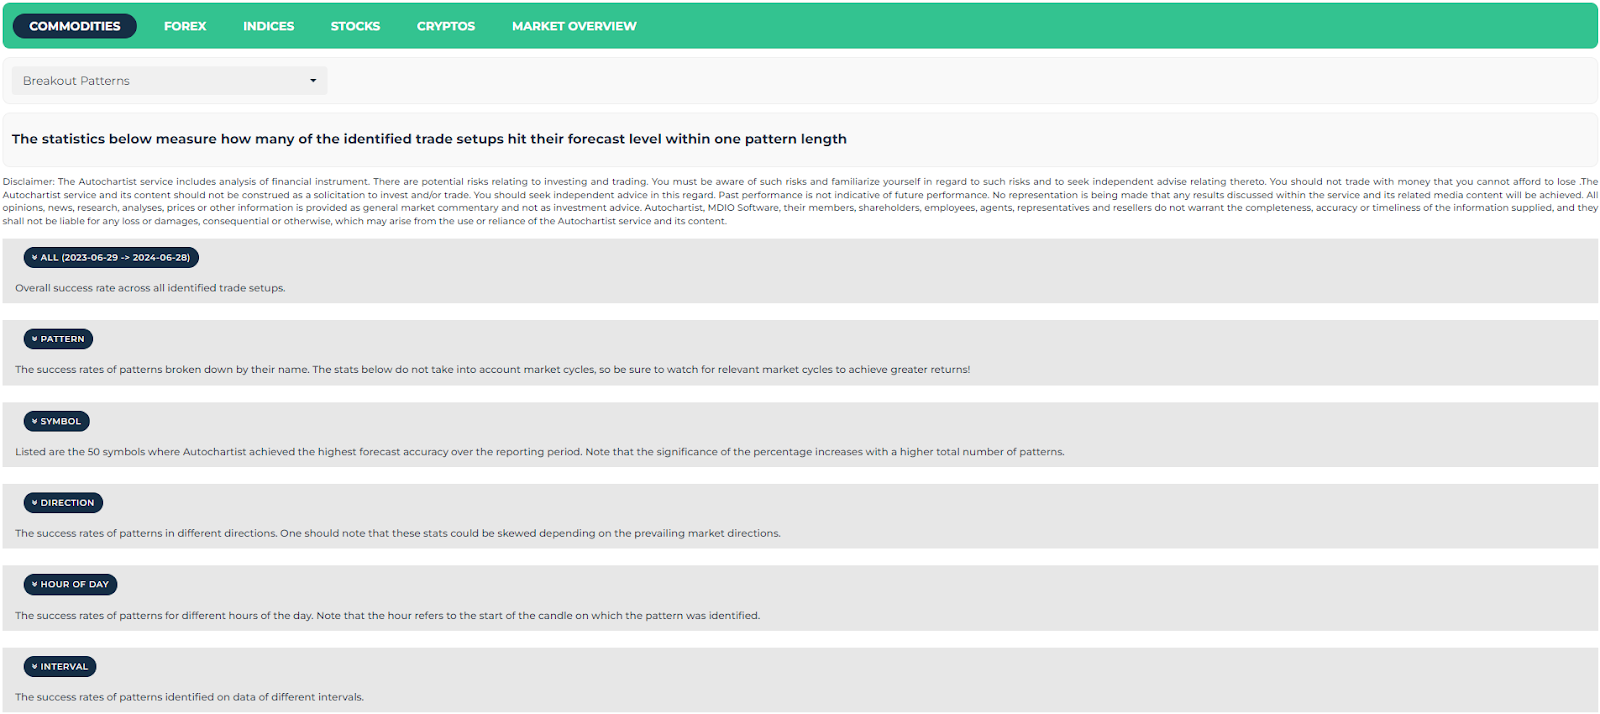
The image below shows an overview of the Performance Statistics Tool.
Statistics can be filtered by asset class and either breakout or emerging patterns:
Further data is available on the success rate of pattern types, symbols, direction and hour of the day that the patterns were identified.