An Introduction to Volatility Analysis
Our Volatility Analysis tool offers a detailed forecast of expected trading ranges across all instruments, designed to enhance your traders' strategic decision-making. This tool breaks down the expected price movements into clear, actionable insights for the next 1 hour, 4 hours, and 24 hours. With its user-friendly visual presentations and comprehensive data, this tool empowers traders at all levels—from beginners to experts—to effectively navigate and capitalize on market volatility. By integrating Volatility Analysis into their trading approach, your traders can make more informed decisions, even in the most dynamic market environments. This is a crucial resource for optimizing trading strategies and improving overall market performance.
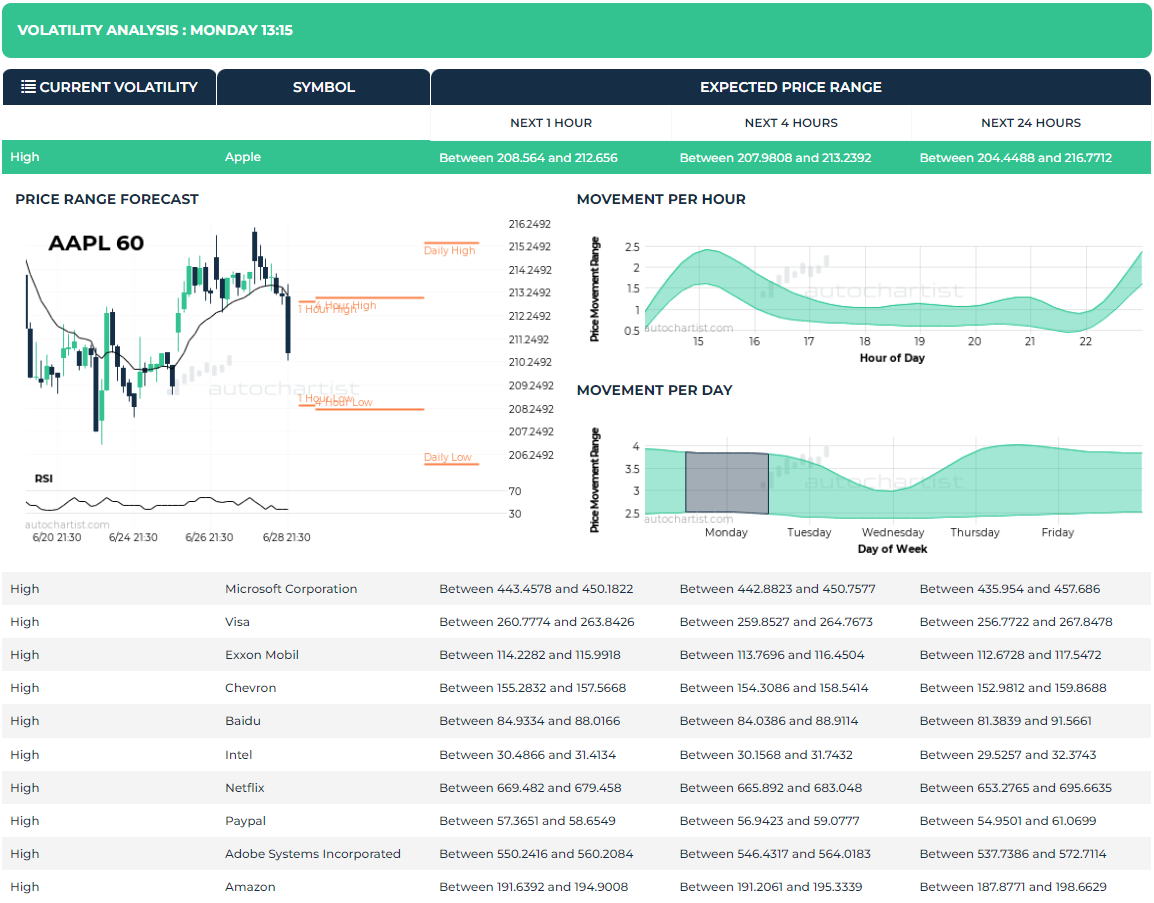
An Overview of the Volatility Analysis Tool
More Details Available for each Symbol
When preparing for his day trading activities, a trader often has little or no idea what trading style he will use that day. He often chooses to begin with no bias to the short side or the long side, either.
Although he believes in a systematic approach, he is most likely not actually using a trading system. Many of his trading decisions are based on his interpretation of chart patterns and what he deems to be the best entry and exit strategy. This process may include using support and resistance levels to trigger his buy and sell signals. Time is probably not even a consideration other than the time period of the chart he chooses to follow.
Taking an almost fearless approach to day-trading the market, he believes he will achieve success by going where the market will take him using his interpretation of the order flow. Early in the session, he may achieve moderate success but then begins to suffer a few setbacks. A small series of losses occur, and he is forced to become more analytical about his approach.
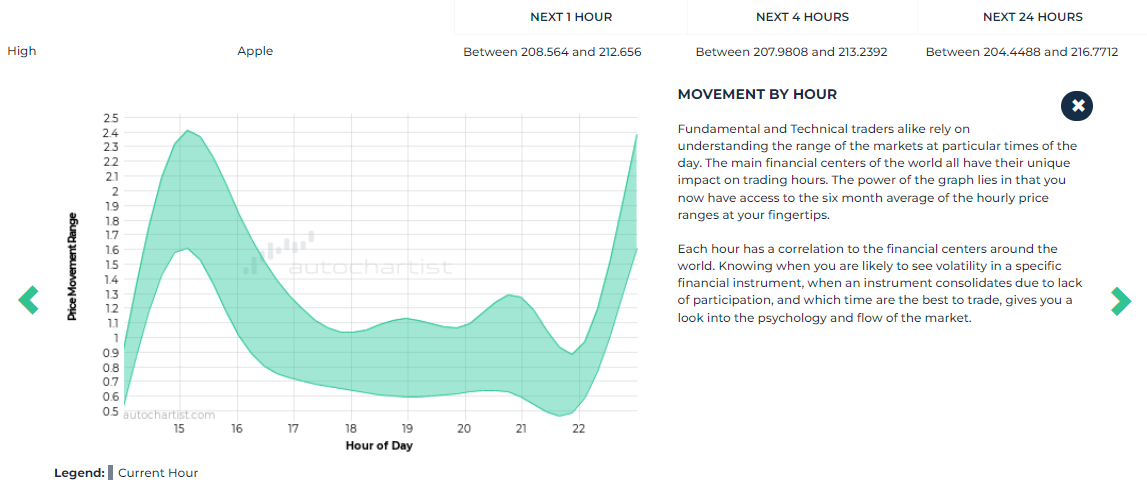
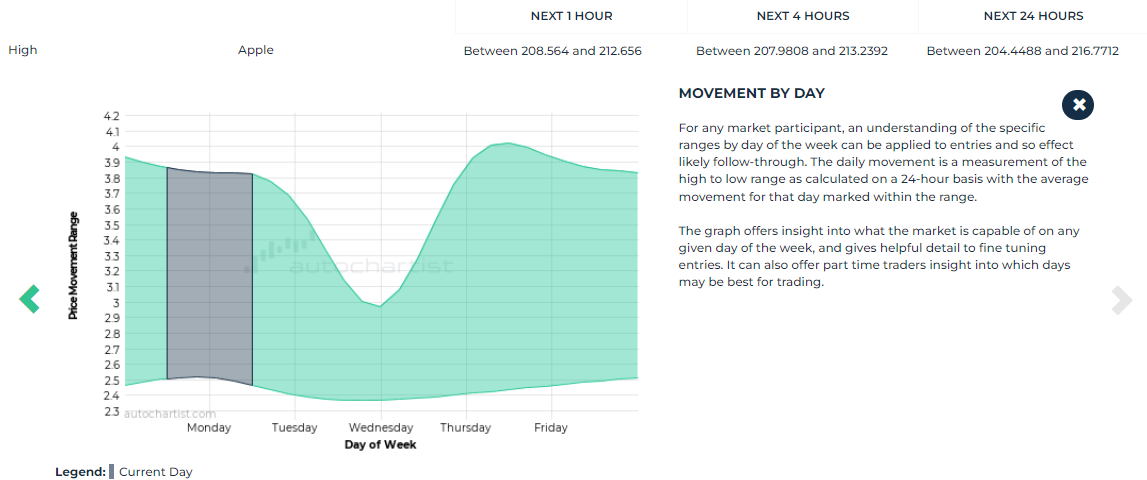
The problem is that he hasn’t figured out exactly what he is looking for. His reliance on “going with the flow” of the trade has blinded him to the tendencies of the markets. These may include the expected movement per day or intraday, as well as the time of day.
Besides the chart patterns and quality indicators generated, Autochartist also provides an analytical tool for traders that offers insight into the relative movements of the Forex, Futures, Index CFD, and Equities markets.
This information can prove to be a valuable resource for traders when assessing the reward/risk of a particular chart pattern by providing the trader with information regarding possible price projections, risk parameters, and time-related tendencies.
Autochartist Volatility Analysis is an analytical instrument that provides the Forex trader with information on the average pip movement during specific time frames, the likelihood of upside or downside momentum (based on history), the maximum expected price movements (statistical highs and lows) across various time frames, and expected price movements over weekday and hourly time frames.
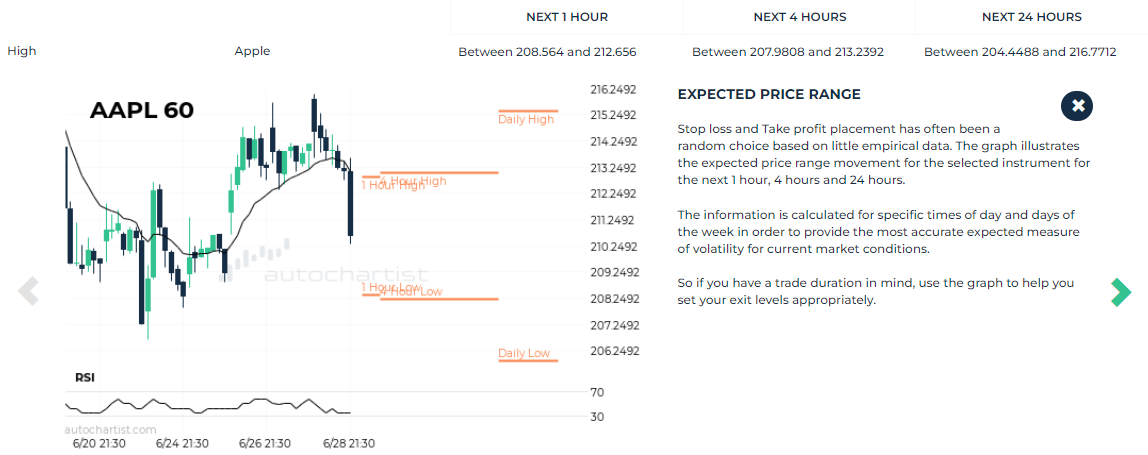
The average movement during specific time frames is important information for a trader because it takes the guesswork out of figuring out where a market will move or if upside and downside objectives are reasonable. Instead of trying to manually figure out profit targets and stop losses while determining which trade position to enter, a trader can use empirical data to set stop loss or profit targets, thus eliminating the randomness of such a choice.