The chart pattern results identified by Autochartist are accompanied by a number of headings to give traders insight into the quality, type, size and direction of the pattern.
This is exactly the type of information needed to determine the likelihood of any chart pattern triggers and the follow- through. Each of these headings should be studied from which a conclusion can be drawn as to the best trading approach to take.
Below is an example of the chart pattern results for the GBPCHF foreign exchange pair.
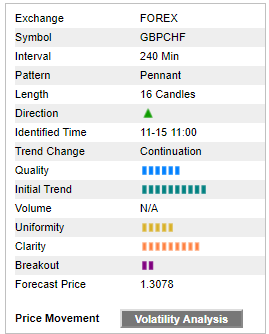 Exchange
 refers to an organization that facilitates the trade in financial securities, e.g., a stock exchange or commodity exchange.
Symbol refers to the ticker of the symbol on which the pattern was found.
Interval refers to the interval of the data on which the pattern was identified. If all patterns in your search were identified on the same interval, this column will be hidden.
Pattern refers to the name of the identified pattern.
Length refers to the length of the pattern in bars e.g. a pattern of length 30 found on 60-minute data would mean that the pattern was formed over 30 trading hours.
Direction refers to the direction in which the breakout occurred. A green arrow pointing up represents a breakout through the resistance line. A red arrow pointing down represents a breakout through the support line. In the case of some patterns white arrows pointing both up and down represent the anticipated breakout direction.
Identified Time refers to the date and time the identified pattern ended.
Trend Change refers to whether the pattern is a continuation or reversal pattern.
Quality refers to the overall quality of the pattern. It is the average of all the other quality indicators.
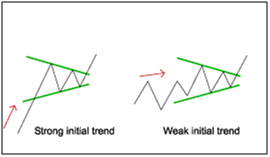
Initial Trend refers to the strength of the trend prior to the formation of the pattern in order to gauge the potential movement of the price after breakout.
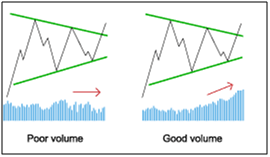
Volume refers to the relative amount of increase in the trading volume at the time of breakout through the support or resistance line. Note that this quality measure is irrelevant for emerging patterns.
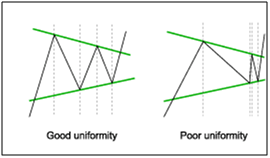
Uniformity refers to how the market spends its time inside support and resistance boundaries. Factors taken into consideration by Autochartist to provide a uniformity rating may include the spacing between high/low swings and the distance and duration between two bottoms or two tops. Simply stated, the Uniformity of a pattern can best be described by how well the price action fills in the chart pattern.
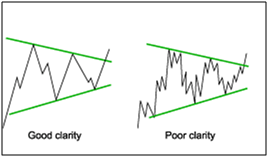
Clarity refers to the way price action is behaving between support and resistance levels. Factors such as price gaps, randomness of price action, and sudden shifts of direction are used and then compared to the support and resistance lines which help define the pattern. Therefore, low clarity patterns tend to take place outside of the clearly defined support and resistance lines while high clarity patterns tend to be created inside of upper and lower boundaries.
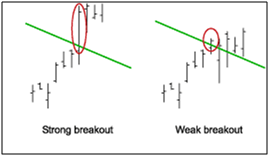
Breakout refers to the decisiveness with which the price broke through the support or resistance line. Note that this quality measure is irrelevant for emerging patterns.
Price Forecast refers to an automatic indication of where the market may begin to breakout, and where the market may move to after the breakout. In addition to the forecast projected by the chart pattern, Autochartist Volatility Analysis also offers price projections that can be used to enhance the viability of the pattern.
Below are some visuals of good or strong vs. poor or weak Quality Indicators:
